In this section i will be installing Splunk Enterprise on CENTOS 7 and Universal Forwarder on Windows. Last part is all about setting up Sysmon on windows machine
Installing Splunk and getting first Logs
Installing Splunk Enterprise on CentOS 7
So i will be installing Splunk Enterprise on CentOS7. System has fixed IP address.
1
2
3
[luka@localhost ~]$ uname -a
Linux localhost.localdomain 3.10.0-1127.el7.x86_64 #1 SMP Tue Mar 31 23:36:51 UTC 2020 x86_64 x86_64 x86_64 GNU/Linux
[luka@localhost ~]$
(Installing on Debian-based Linux system should not be much different)
So let’s grab the Splunk now…
Downloading Splunk from splunk.com
For download you will need to login. You can follow Free Splunk Link on https://www.splunk.com/de_de/download/splunk-enterprise.html. You should get to download page eventually:
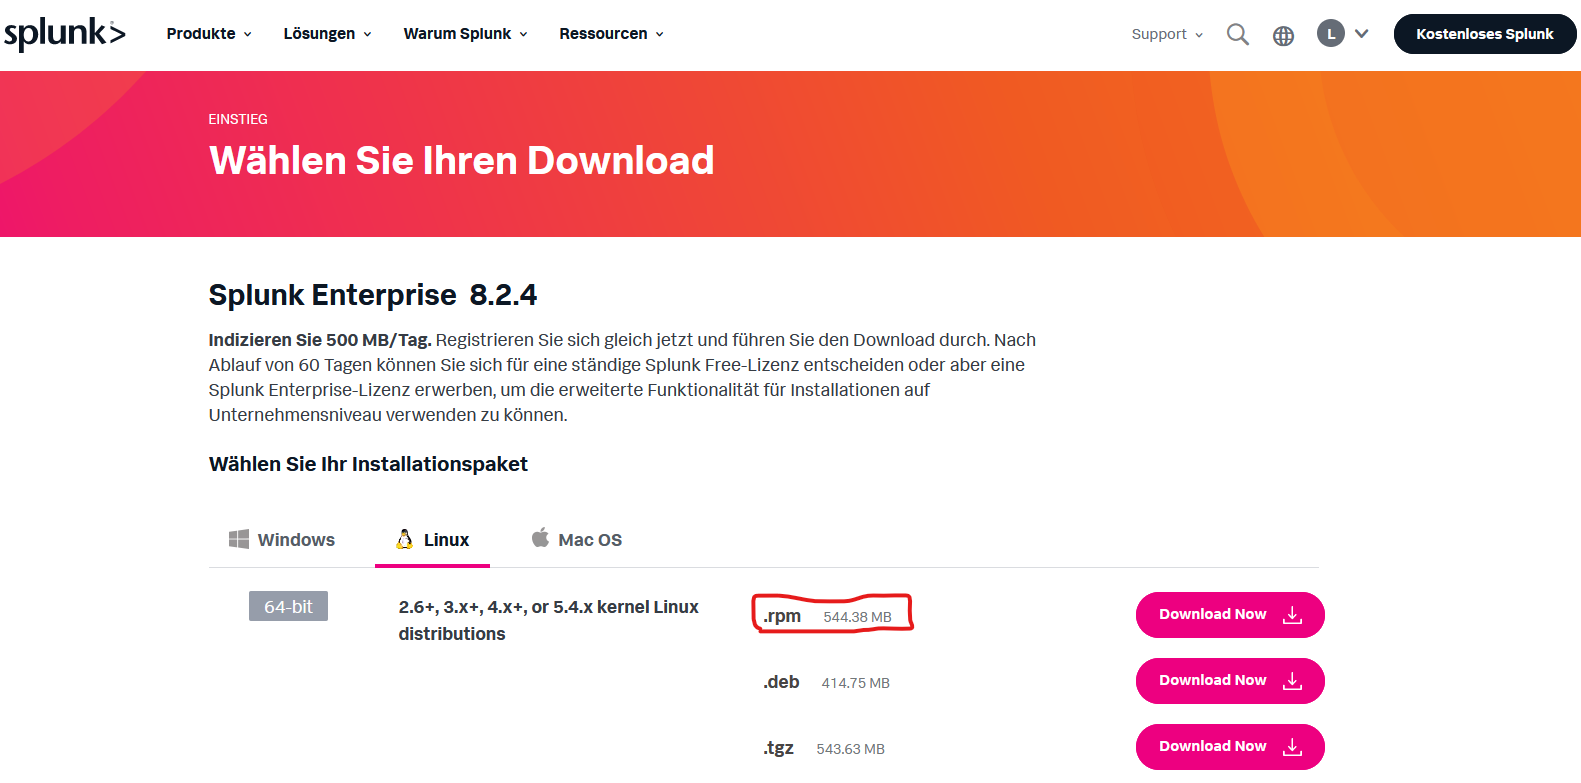
I will be chosing `.rpm` because CentOS is Fedora-based.

Uploading Splunk to CentOS 7
With Splunk installer on the Disk i will need to transfer it to the actual CentOS system (as Splunk Enterprise was downloaded on Host - Windows machine.)
1
2
3
4
PS C:\Users\lukao\Downloads> scp .\splunk-8.2.4-87e2dda940d1-linux-2.6-x86_64.rpm luka@192.168.253.221:/tmp/
luka@192.168.253.221's password:
splunk-8.2.4-87e2dda940d1-linux-2.6-x86_64.rpm                                        100%  544MB  43.4MB/s   00:12
PS C:\Users\lukao\Downloads>
Splunk Installation
Let’s install Splunk on CentOS. (installing as root however splunk will be running under splunk user)
1
2
3
4
5
6
7
8
9
10
11
12
13
14
15
16
17
18
19
20
21
22
23
24
25
26
27
28
29
30
31
32
33
34
35
36
37
38
39
40
41
42
43
44
45
46
47
48
49
50
51
52
53
54
55
56
[root@localhost splunk]# yum localinstall /tmp/splunk-8.2.4-87e2dda940d1-linux-2.6-x86_64.rpm
Loaded plugins: fastestmirror
Examining /tmp/splunk-8.2.4-87e2dda940d1-linux-2.6-x86_64.rpm: splunk-8.2.4-87e2dda940d1.x86_64
Marking /tmp/splunk-8.2.4-87e2dda940d1-linux-2.6-x86_64.rpm to be installed
Resolving Dependencies
--> Running transaction check
---> Package splunk.x86_64 0:8.2.4-87e2dda940d1 will be installed
--> Finished Dependency Resolution

Dependencies Resolved

=====================================================================================================================
 Package        Arch           Version                     Repository                                           Size
=====================================================================================================================
Installing:
 splunk         x86_64         8.2.4-87e2dda940d1          /splunk-8.2.4-87e2dda940d1-linux-2.6-x86_64         1.4 G

Transaction Summary
=====================================================================================================================
Install  1 Package

Total size: 1.4 G
Installed size: 1.4 G
Is this ok [y/d/N]: y
Downloading packages:

.........
.........

Do you agree with this license? [y/n]: y

This appears to be your first time running this version of Splunk.

Splunk software must create an administrator account during startup. Otherwise, you cannot log in.
Create credentials for the administrator account.
Characters do not appear on the screen when you type in credentials.

Please enter an administrator username: splunk
Password must contain at least:
   * 8 total printable ASCII character(s).
Please enter a new password:
Please confirm new password:
Copying '/opt/splunk/etc/openldap/ldap.conf.default' to '/opt/splunk/etc/openldap/ldap.conf'.
Generating RSA private key, 2048 bit long modulus
.......................................+++++
...........................+++++
e is 65537 (0x10001)
writing RSA key

Generating RSA private key, 2048 bit long modulus
.....................+++++
..................................................+++++
e is 65537 (0x10001)
writing RSA key

Moving '/opt/splunk/share/splunk/search_mrsparkle/modules.new' to '/opt/splunk/share/splunk/search_mrsparkle/modules'.
Starting Splunk Enterprise
After succesfully installing Splunk Enterprise it’s time to start it.
1
2
3
4
5
6
7
8
9
10
11
12
13
14
15
16
17
18
19
20
21
22
23
24
25
26
27
28
29
30
31
32
33
34
35
36
37
38
39
40
41
42
43
44
45
46
47
48
49
50
51
52
[root@localhost splunk]# splunk start

Splunk> Australian for grep.

Checking prerequisites...
        Checking http port [8000]: open
        Checking mgmt port [8089]: open
        Checking appserver port [127.0.0.1:8065]: open
        Checking kvstore port [8191]: open
        Checking configuration... Done.
                Creating: /opt/splunk/var/run/splunk/appserver/i18n
                Creating: /opt/splunk/var/run/splunk/appserver/modules/static/css
                Creating: /opt/splunk/var/run/splunk/upload
                Creating: /opt/splunk/var/run/splunk/search_telemetry
                Creating: /opt/splunk/var/spool/splunk
                Creating: /opt/splunk/var/spool/dirmoncache
                Creating: /opt/splunk/var/lib/splunk/authDb
                Creating: /opt/splunk/var/lib/splunk/hashDb
New certs have been generated in '/opt/splunk/etc/auth'.
        Checking critical directories...        Done
        Checking indexes...
                Validated: _audit _internal _introspection _metrics _metrics_rollup _telemetry _thefishbucket history main summary
        Done
        Checking filesystem compatibility...  Done
        Checking conf files for problems...
        Done
        Checking default conf files for edits...
        Validating installed files against hashes from '/opt/splunk/splunk-8.2.4-87e2dda940d1-linux-2.6-x86_64-manifest'
        All installed files intact.
        Done
All preliminary checks passed.

Starting splunk server daemon (splunkd)...
Generating a RSA private key
..........................+++++
....+++++
writing new private key to 'privKeySecure.pem'
-----
Signature ok
subject=/CN=localhost.localdomain/O=SplunkUser
Getting CA Private Key
writing RSA key
Done
                                                           [  OK  ]

Waiting for web server at http://127.0.0.1:8000 to be available................. Done


If you get stuck, we're here to help.
Look for answers here: http://docs.splunk.com

The Splunk web interface is at http://127.0.0.1:8000
Now let’s verify if it is really running and if ports are listening:
1
2
3
[root@localhost splunk]# ss -antp | grep splunkd
LISTEN     0      128          *:8089                     *:*                   users:(("splunkd",pid=9835,fd=4))
LISTEN     0      128          *:8000                     *:*                   users:(("splunkd",pid=9835,fd=153))
Opening Ports on local firewall using IPTables
So everything’s looking good BUT at least on CentOS 7 i have to allow Ports on local firewall.
1
2
3
4
[luka@localhost ~]$ sudo firewall-cmd --zone=public --add-port=8000/tcp --permanent
success
[luka@localhost ~]$ sudo firewall-cmd --reload
success
Checking if Splunk Web Interface is working
Check the IP on port 8000 if Splunk is reachable. I’ll be accessing Splunk remotely as CentOS has no GUI installed.
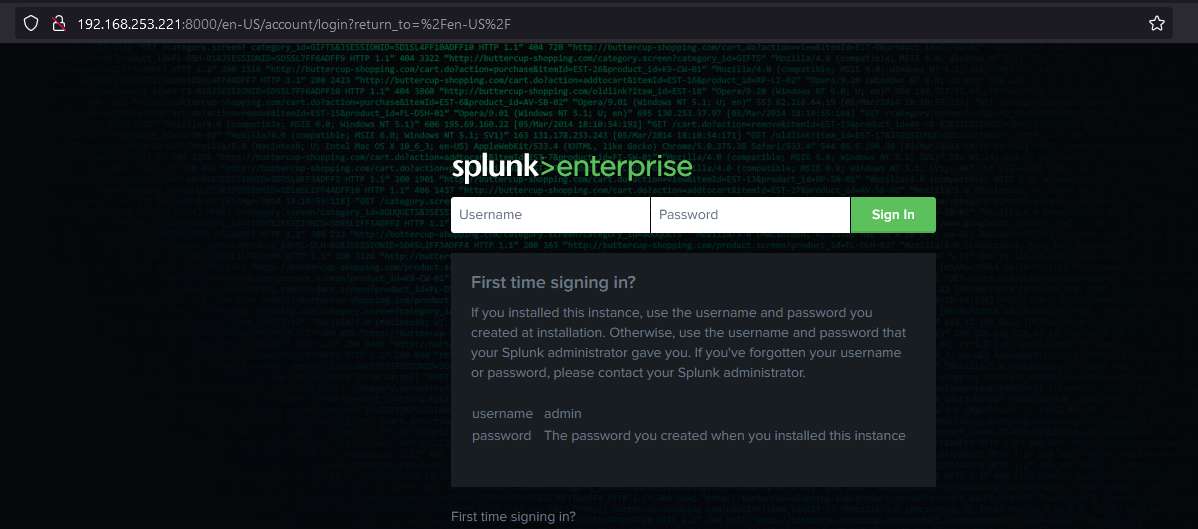
Login worked for me with credentials used during installation.
So that’s already it. Now we need to fed our Splunk instance with logs. I will use Universal Forwarder on Windows to do that.
Set TimeZone for User
Set up timezone in preferences after login.

Installing Splunk Universal Forwarder on Windows
… the manual way!
Universal Forwarder installation on Windows is very straightforward as you will see.
Downloading Splunk Universal Forwarder

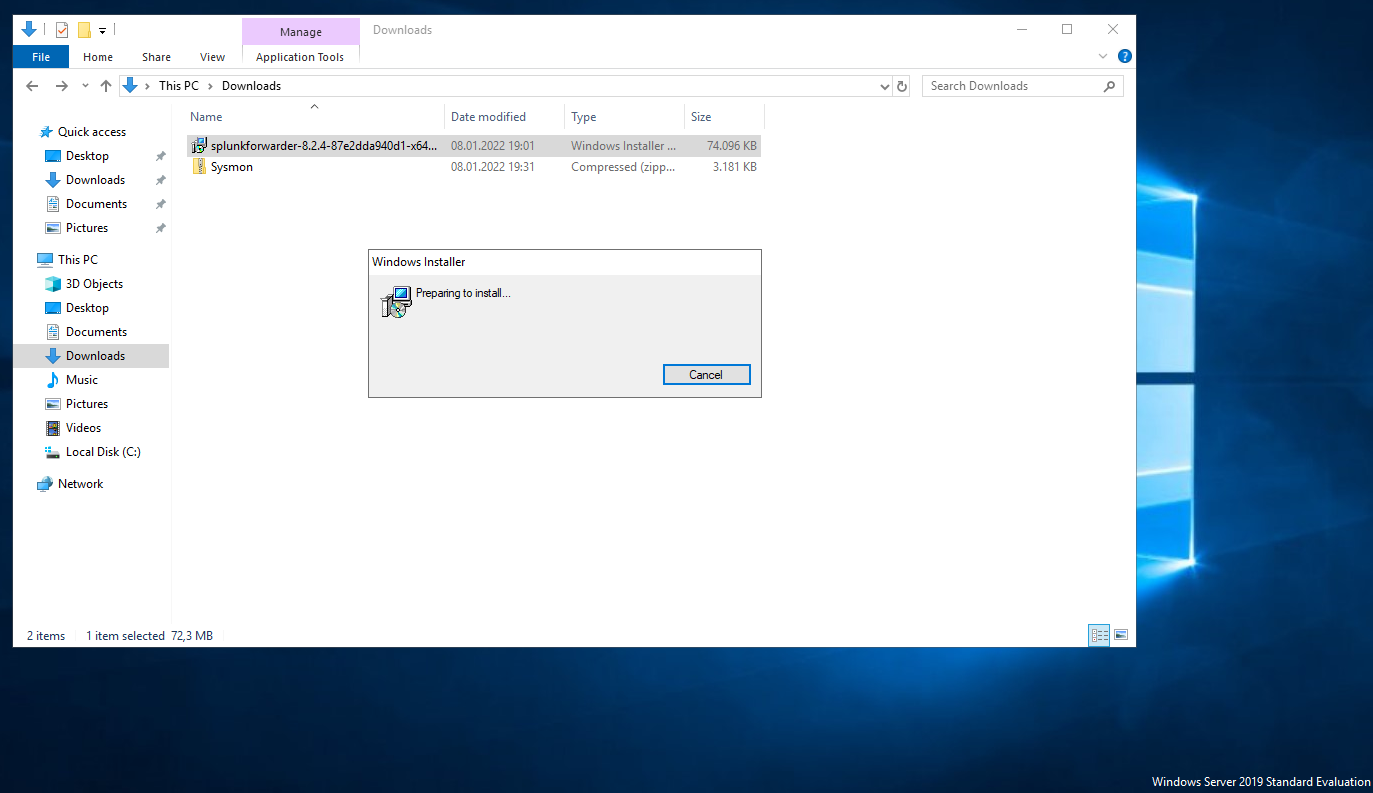
Now let’s move the msi onto the Windows server if needed. Using VMWare Tools it’s even possible to copy/paste files but if that is not possible i’ll include creating share in the end as bonus.
Allright! Let’s start with installation.
Splunk Universal Forwarder installation
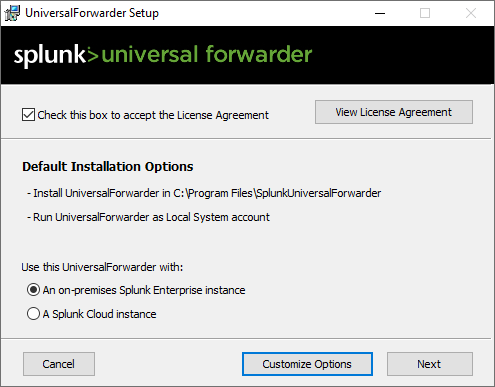
Let’s accept the License Agreement and choose on-premises Splunk Enterprise instance.
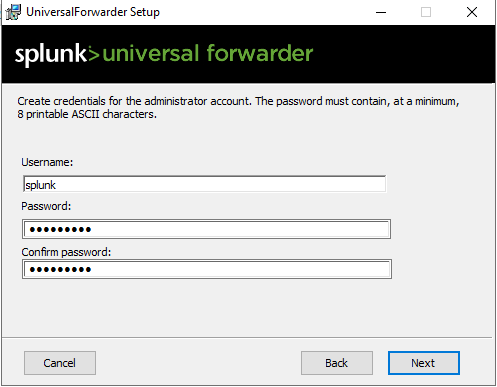
Create User
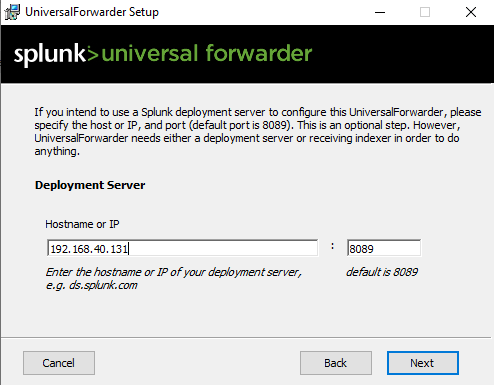
Set the IP of deployment server (which is local machine)
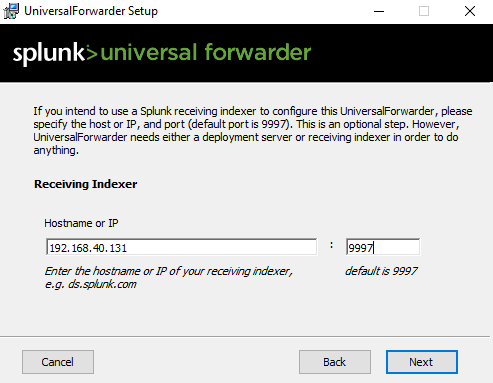
Indexer will be local as well.
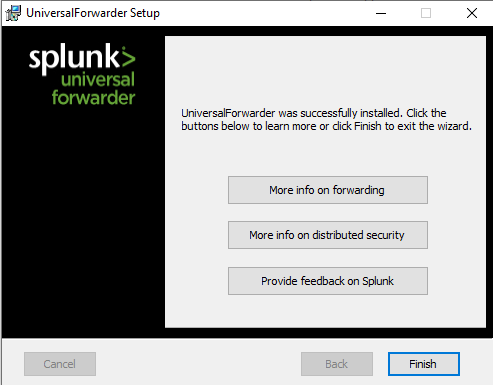
Installation should be completed at this point
Opening additional Ports on CentOS
Don’t forget to open 8089 and 9997 ports on CentOS
1
2
3
4
5
6
[luka@localhost ~]$ sudo firewall-cmd --zone=public --add-port=9997/tcp --permanent
success
[luka@localhost ~]$ sudo firewall-cmd --zone=public --add-port=8089/tcp --permanent
success
[luka@localhost ~]$ sudo firewall-cmd --reload
success
Installation was relatively straightforward. Configuration of logging itself it will be a bit more challenging.
Getting Logs into the Splunk
Now as everything has been installed it’s time for configuration.
First of all let’s add recieving port
Adding recieving port
So first, we need one port where we will recieve the logs. As set previously, i’ll set it to 9997.


Configuring Index
Next we’ll need to configure index IF we decide to not send our logs. I’ll use another index for windows logs.
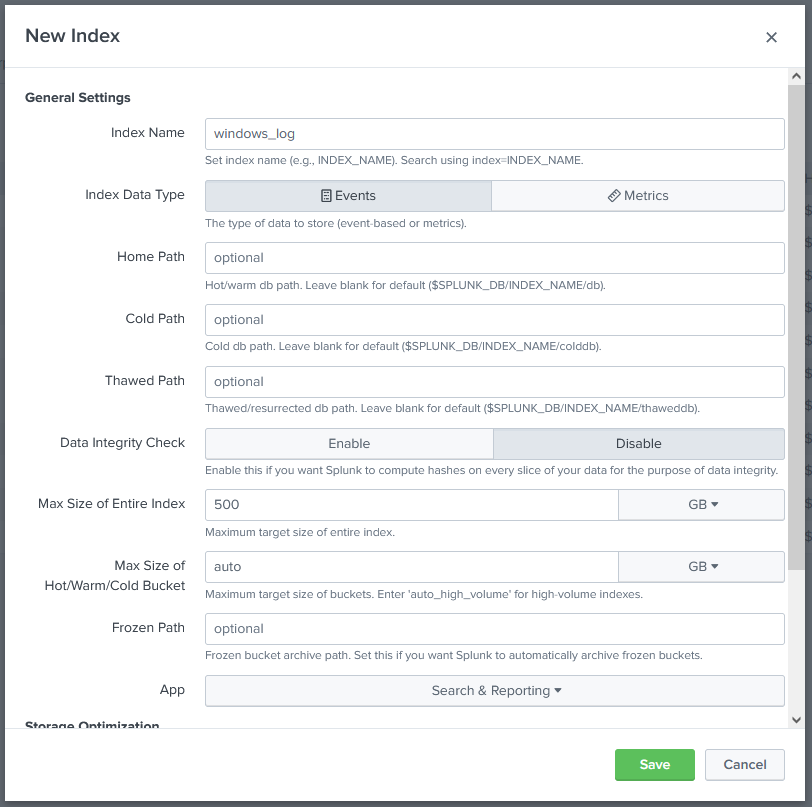
I’ve only changed the name and set the retention time to 2 weeks. I might change that if needed.
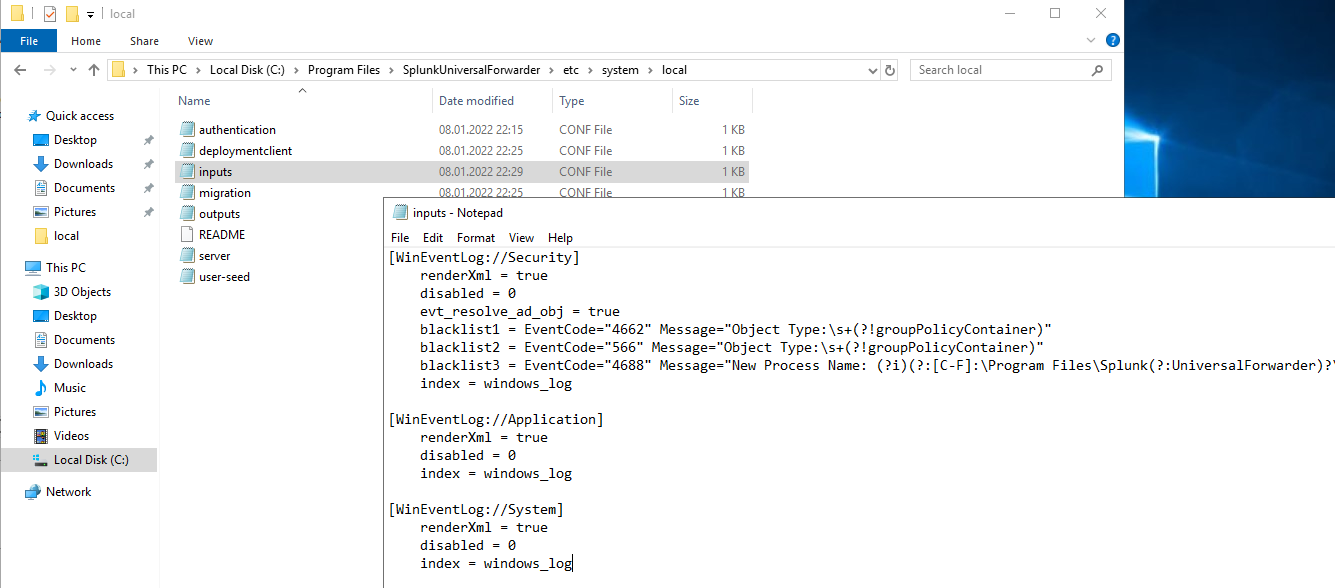
Tweaking inputs.conf on the Client
So all settings will stay as they are on universal forwarder apart from a file named inputs.conf. Here we’ll define what we want to log. Now for starters let’s just get normal logs onboarded.
1
2
3
4
5
6
7
8
9
10
11
12
13
14
15
16
17
18
[WinEventLog://Security]
    renderXml = true
    disabled = 0
    evt_resolve_ad_obj = true
    blacklist1 = EventCode="4662" Message="Object Type:\s+(?!groupPolicyContainer)"
    blacklist2 = EventCode="566" Message="Object Type:\s+(?!groupPolicyContainer)"
    blacklist3 = EventCode="4688" Message="New Process Name: (?i)(?:[C-F]:\Program Files\Splunk(?:UniversalForwarder)?\bin\(?:btool|splunkd|splunk|splunk-(?:MonitorNoHandle|admon|netmon|perfmon|powershell|regmon|winevtlog|winhostinfo|winprintmon|wmi)).exe)"
    index = windows_log

[WinEventLog://Application]
    renderXml = true
    disabled = 0
    index = windows_log

[WinEventLog://System]
    renderXml = true
    disabled = 0
    index = windows_log
I’ve set index to “windows_log”. The rest should be selfexplainatory. If not check this link https://community.splunk.com/t5/All-Apps-and-Add-ons/How-do-I-collect-basic-Windows-OS-Event-Log-data-from-my-Windows/m-p/440187
Restarting SplunkForwarder Service
In order to apply custom settings (after changing inputs.conf), service needs to be restarted, so let’s do that and check if SplunkForwarder service is working. We can use “services.msc” for that or powershells Restart-Service (or net start/stop).
1
2
3
4
5
6
7
8
9
10
11
12
13
14
15
16
17
18
19
20
21
22
23
C:\>powershell Restart-Service SplunkForwarder
WARNING: Waiting for service 'SplunkForwarder Service (SplunkForwarder)' to start...
WARNING: Waiting for service 'SplunkForwarder Service (SplunkForwarder)' to start...
WARNING: Waiting for service 'SplunkForwarder Service (SplunkForwarder)' to start...

C:\>powershell get-service -Name SplunkForwarder

Status   Name               DisplayName
------   ----               -----------
Running  SplunkForwarder    SplunkForwarder Service


C:\>sc query SplunkForwarder

SERVICE_NAME: SplunkForwarder
        TYPE               : 10  WIN32_OWN_PROCESS
        STATE              : 4  RUNNING
                                (STOPPABLE, NOT_PAUSABLE, ACCEPTS_SHUTDOWN)
        WIN32_EXIT_CODE    : 0  (0x0)
        SERVICE_EXIT_CODE  : 0  (0x0)
        CHECKPOINT         : 0x0
        WAIT_HINT          : 0x0
After few seconds, Logs should start popping up in Splunk.

Great! Logs are there - if you’re like me than you’d also like to have more granularity on that like seing powershell commands started etc. This can be done using Sysmon which is what we’ll do next.
Advanced Windows Logging using Sysmon
Sysmon: https://docs.microsoft.com/en-us/sysinternals/downloads/sysmon
SysmonConfig: https://github.com/olafhartong/sysmon-modular
Installing Sysmon Service
Unpack Sysmon and Sysmon’s config. Import Module
1
2
3
4
5
6
7
8
9
10
11
12
13
14
15
16
17
18
19
20
21
22
23
24
25
26
27
28
29
30
31
32
33
34
35
36
PS C:\sysmon\sysmon-modular-master> Import-Module .\Merge-SysmonXml.ps1

   //**                  ***//
  ///#(**               **%(///
  ((&&&**               **&&&((
   (&&&**   ,(((((((.   **&&&(
   ((&&**(((((//(((((((/**&&((      _____                                                            __      __
    (&&///((////(((((((///&&(      / ___/__  ___________ ___  ____  ____        ____ ___  ____  ____/ /_  __/ /___ ______
     &////(/////(((((/(////&       \__ \/ / / / ___/ __ `__ \/ __ \/ __ \______/ __ `__ \/ __ \/ __  / / / / / __ `/ ___/
     ((//  /////(/////  /(((      ___/ / /_/ (__  ) / / / / / /_/ / / / /_____/ / / / / / /_/ / /_/ / /_/ / / /_/ / /
    &(((((#.///////// #(((((&    /____/\__, /____/_/ /_/ /_/\____/_/ /_/     /_/ /_/ /_/\____/\__,_/\__,_/_/\__,_/_/
     &&&&((#///////((#((&&&&          /____/
       &&&&(#/***//(#(&&&&
         &&&&****///&&&&                                                                            by Olaf Hartong
            (&    ,&.
             .*&&*.

PS C:\sysmon\sysmon-modular-master> Merge-AllSysmonXml -Path ( Get-ChildItem '[0-9]*\*.xml') -AsString | Out-File sysmonconfig.xml
PS C:\sysmon\sysmon-modular-master> .\Sysmon64.exe -accepteula -i .\sysmonconfig.xml


System Monitor v13.31 - System activity monitor
By Mark Russinovich and Thomas Garnier
Copyright (C) 2014-2021 Microsoft Corporation
Using libxml2. libxml2 is Copyright (C) 1998-2012 Daniel Veillard. All Rights Reserved.
Sysinternals - www.sysinternals.com

Loading configuration file with schema version 4.60
Sysmon schema version: 4.81
Configuration file validated.
Sysmon64 installed.
SysmonDrv installed.
Starting SysmonDrv.
SysmonDrv started.
Starting Sysmon64..
Sysmon64 started.
Enabling Audit Logging in MMC (Local Policy - not GPO)
Go to MMC

Press CTRL+M
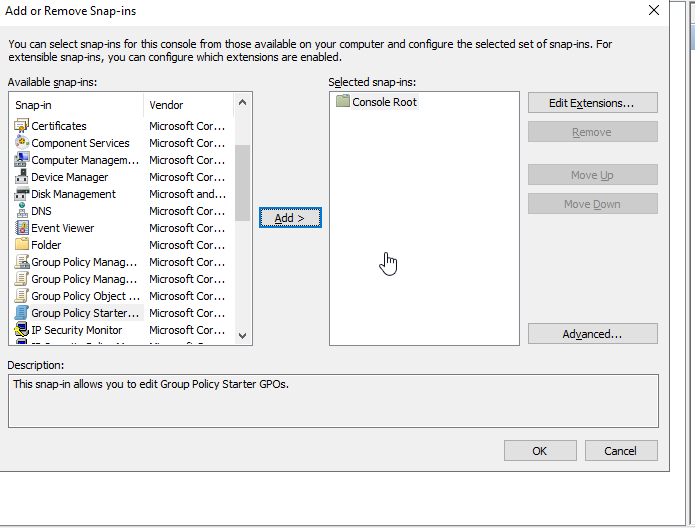
Go to Group Policy Object
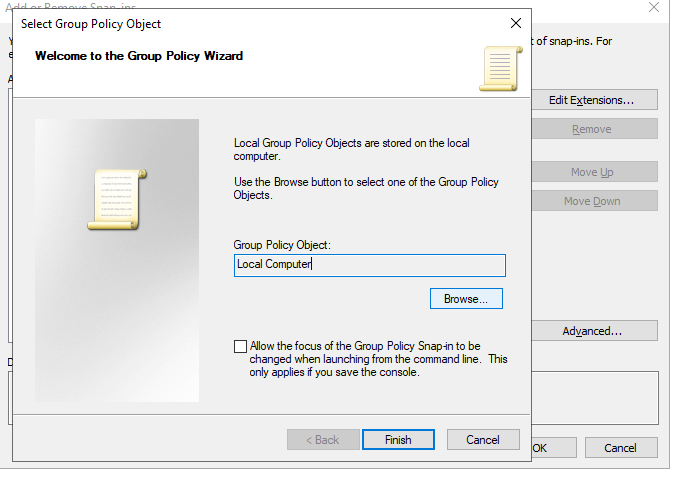
Click on Finish and OK.
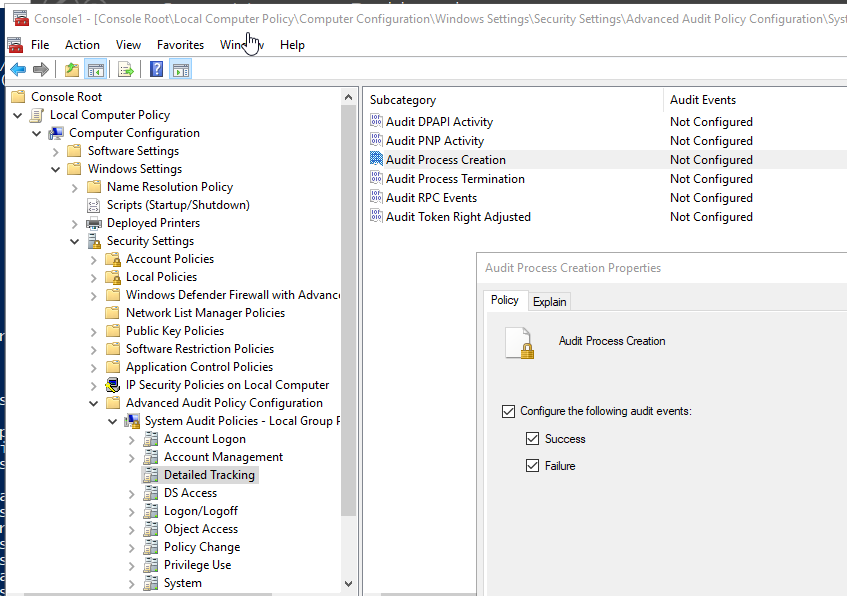
Then go to Detailed Tracking.
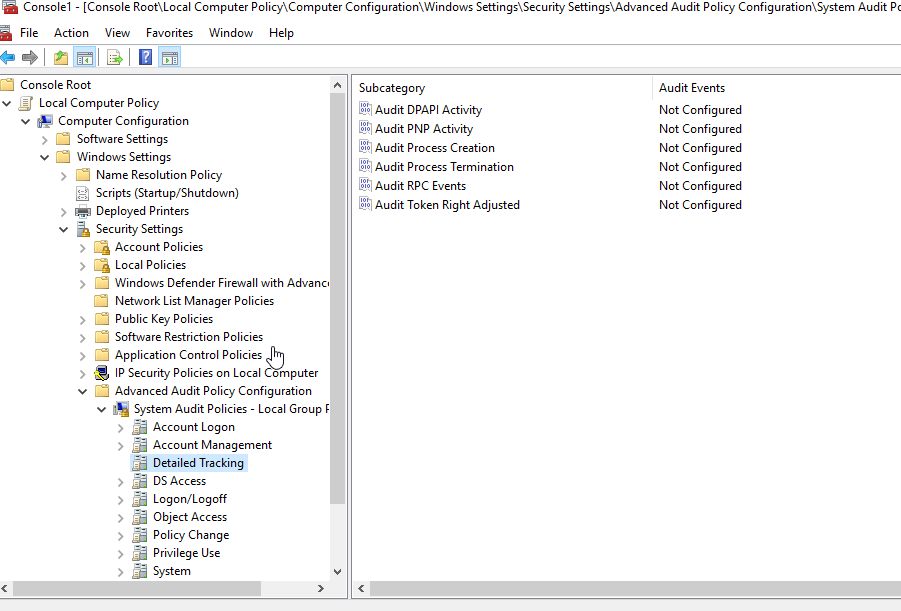
Enable Audit Process Creation
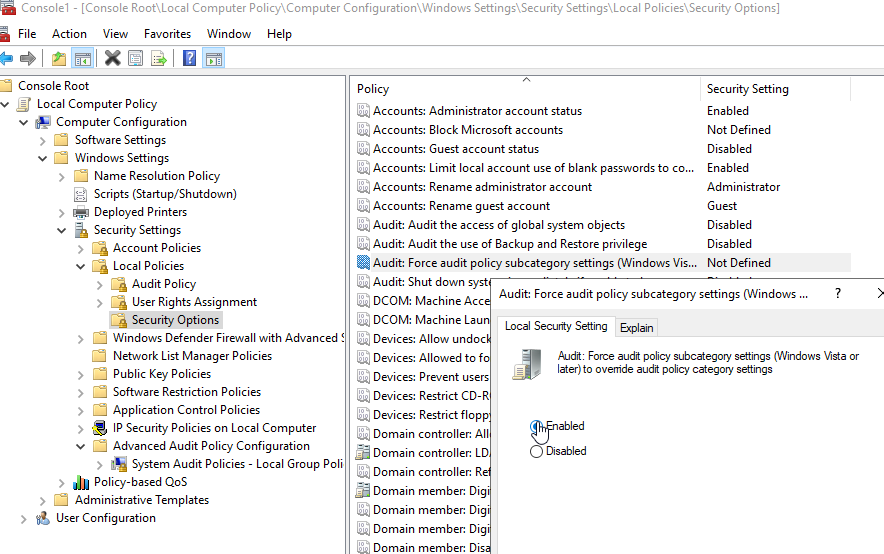
Enable Force audit policy subcategory settings
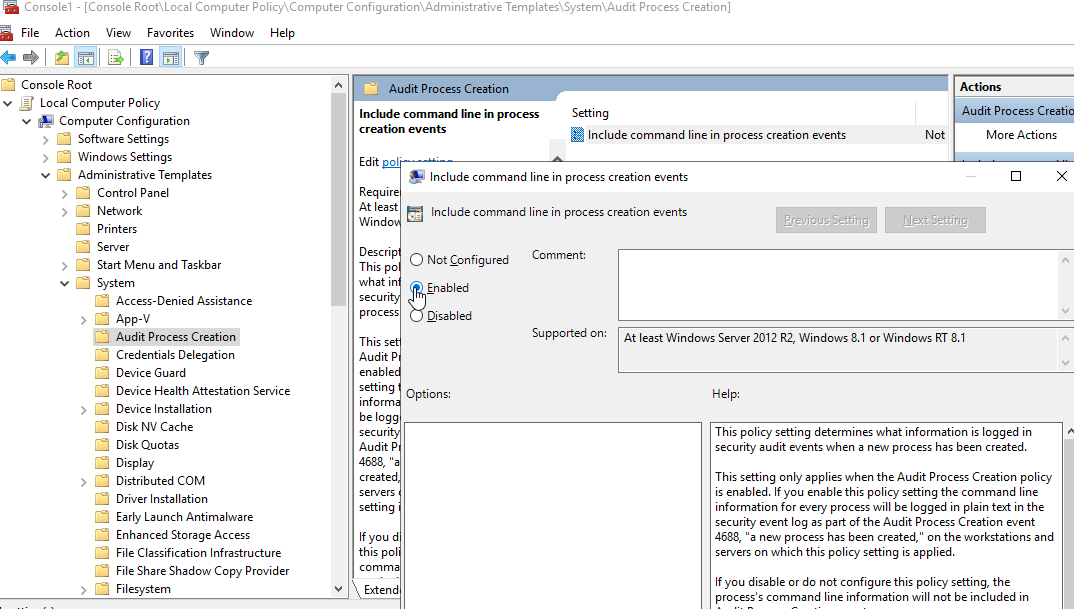
Enable command line in process creation events
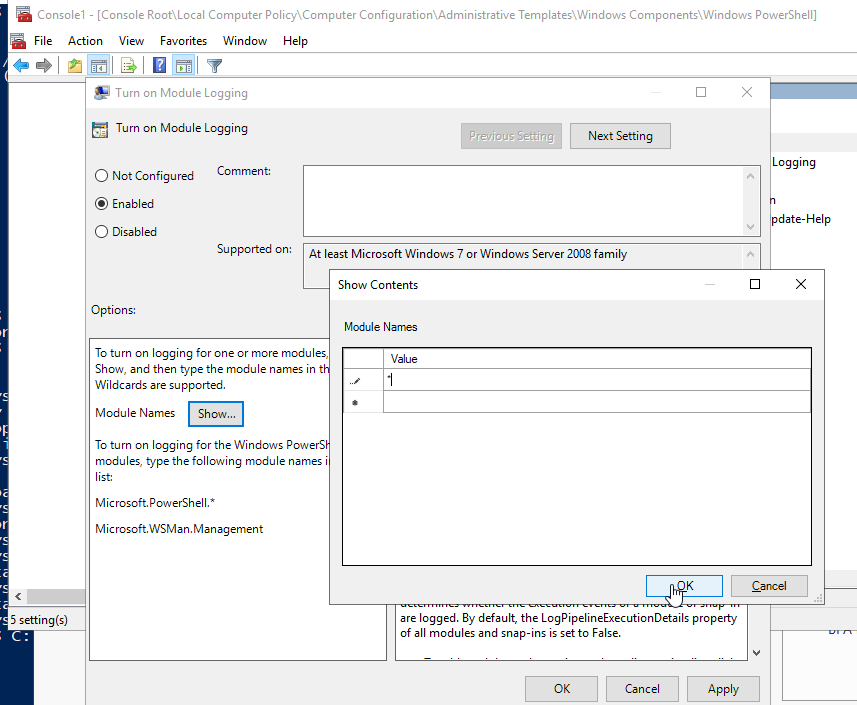
Powershell Module Logging
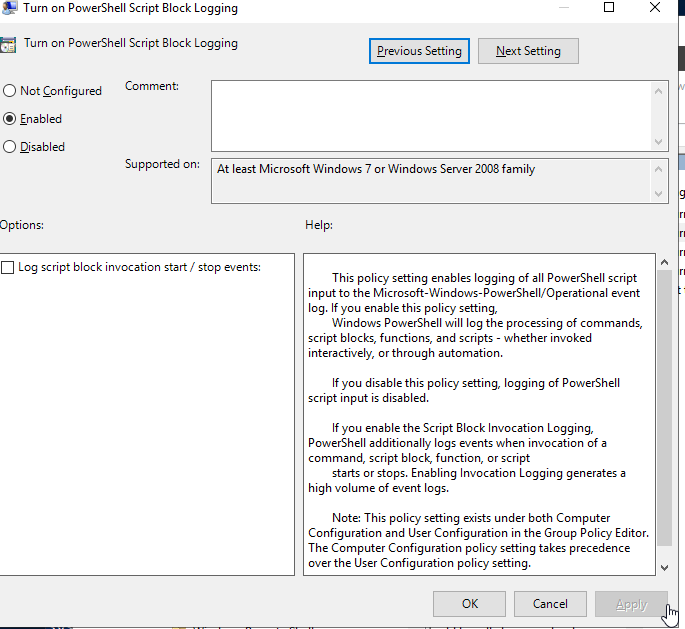
Enable Powershell Script Block Logging
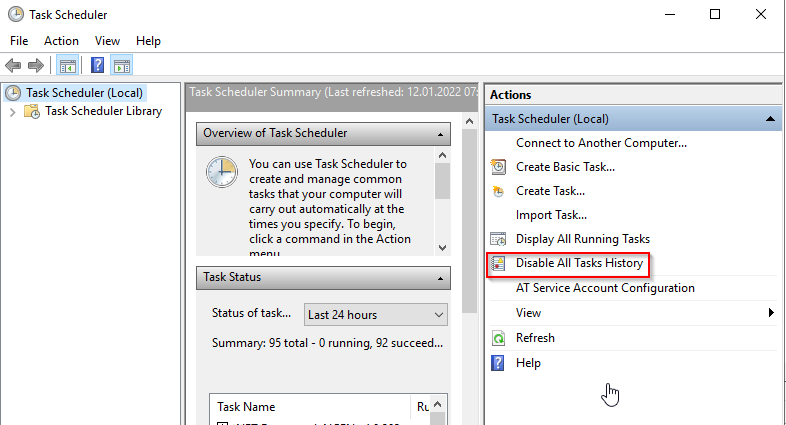
Enable Task Scheduler Logging
Add Sysmon to Splunk Forwarder’s inputs.conf
So let’s do as title says. Open inputs.conf and ADD following block to the rest of the config that was added before.
1
2
3
4
5
6
[WinEventLog://Microsoft-Windows-Sysmon/Operational]
checkpointInterval = 5
current_only = 0
disabled = 0
start_from = oldest
index = windows_log
Restart the SplunkForwarder service.
Logs should be coming into the splunk now.
Install Splunk Add-On for Microsoft Sysmon
Download from Splunkbase and install

Logs should be now visible on Splunk’s Search
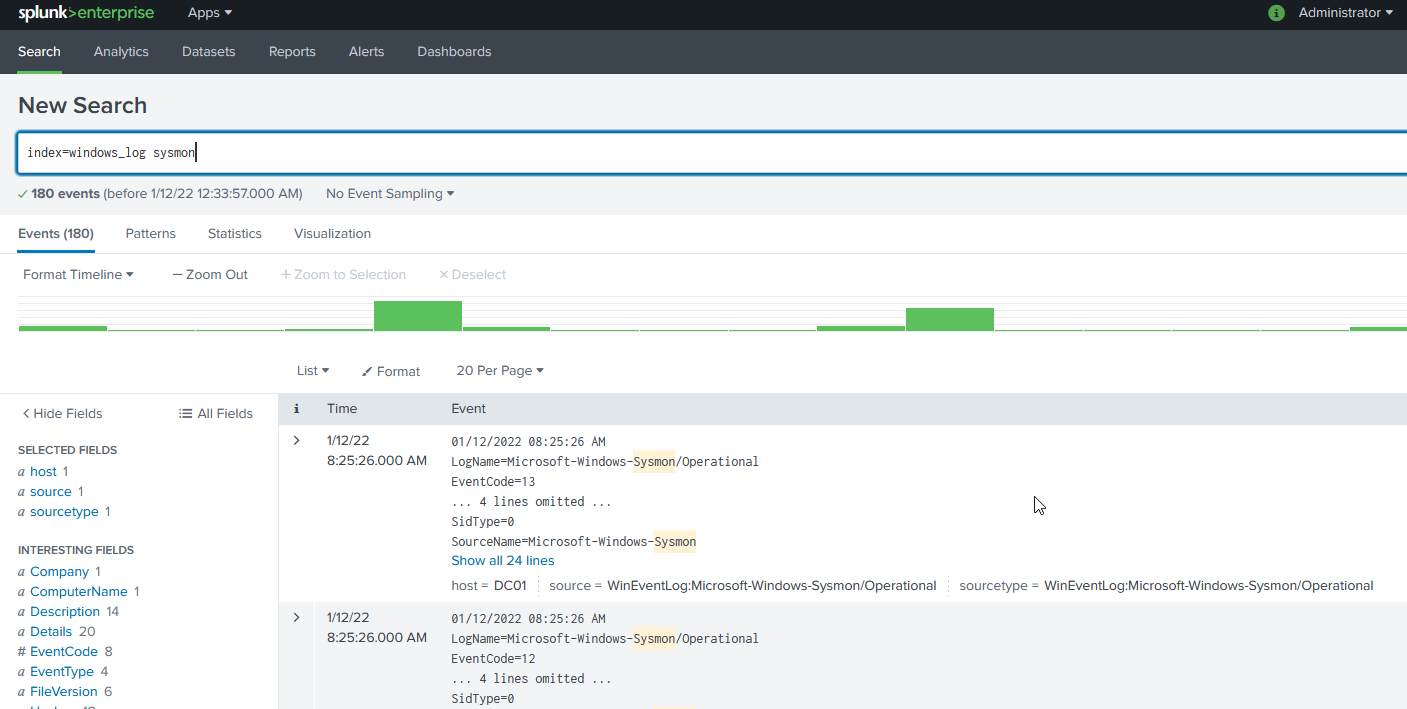
This concludes this chapter. It’s possible to roll this configuration out using GPOs but i’m not confident doing that right now, and i onlyae
Now let’s exploit and hunt!
References
Ippsec’s video: https://www.youtube.com/watch?v=C2cgvpN44is
Windows Docs: https://docs.microsoft.com/en-us/sysinternals/downloads/sysmon
